How to monitor website changes that affect SEO
By TechDash · Published 1 September 2026 · Updated 2 September 2026
A useful SEO monitoring process does not alert on every edit. It watches selected pages and site resources for changes that have an owner and a response.
Start with business risk, choose representative URLs, define the conditions that matter, record a baseline and set a cadence the team can support. When an incident appears, review the evidence, fix the underlying source and rerun the check against the live page.
The operating workflow
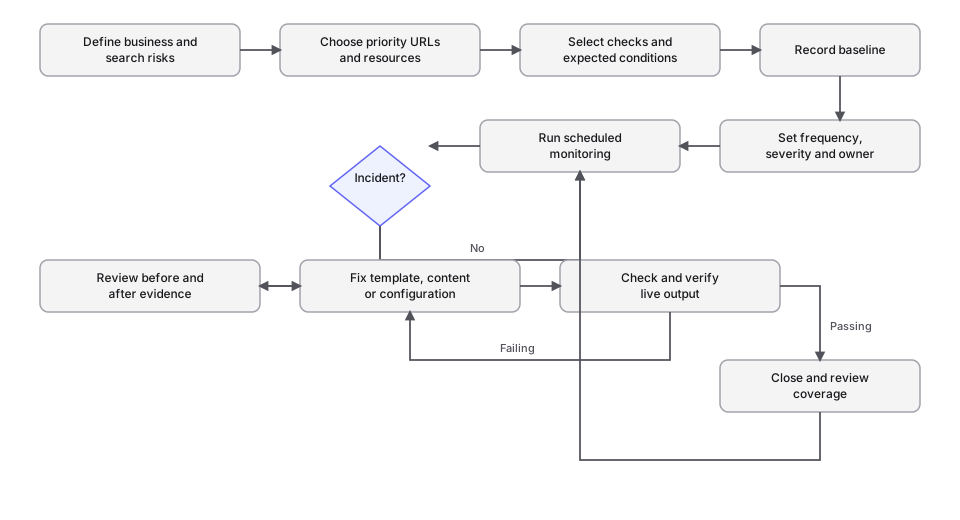
The steps are deliberately circular. Monitoring needs maintenance as templates, priorities and teams change.
1. Define the incidents you care about
Write each requirement as a condition and a consequence.
Scroll sideways to see every column.
| Condition | Possible consequence | Likely owner |
|---|---|---|
Priority page gains noindex |
Page may leave search results after processing | Technical SEO or developer |
| Canonical points to the wrong template | Search signals may be consolidated elsewhere | Technical SEO |
| robots.txt blocks a key directory | Crawlers may be unable to access affected URLs | Technical SEO or platform team |
| Product JSON-LD disappears | Product search presentation may change | Ecommerce developer or SEO |
| Main content collapses | Page offers less useful content | Content owner and developer |
| Tracking tag disappears | Measurement becomes incomplete | Analytics owner |
| Page returns an error or redirect | Users and crawlers see a different response | Developer or operations |
Avoid vague requirements such as “tell us when SEO changes”. They create broad alerts without an agreed response.
2. Select URLs by template and value
Begin with a small set that covers the site's important behaviour.
Representative templates
Choose at least one stable example of each important template:
- Homepage
- Category or listing page
- Product or service detail page
- Editorial article
- Location page
- Conversion landing page
- Pagination or facet example where relevant
One URL per template is a starting point, not proof that every URL is healthy. A full crawler remains useful for discovery and broad audits.
High-value exceptions
Add URLs that deserve individual attention because of revenue, traffic, links, paid campaigns, legal requirements or recent changes. These may need a shorter cadence than the rest of the template.
Sitewide resources
Include resources whose changes can affect many pages:
/robots.txt- Primary XML sitemap
- Important secondary sitemaps
llms.txtif it forms part of the site's policy- SSL, DNS and domain signals where operational ownership is clear
TechDash page selection and bulk-add tools support a selected-page model. Optional Search Console integration can help identify important pages, but it is not required for website monitoring.
3. Choose signals, not generic differences
For each URL, select only checks that support a decision.
Indexability and canonicals
Monitor robots meta directives, X-Robots-Tag, indexability state, canonical target and target health. Record intended exceptions. A filtered page with a deliberate parent canonical should not generate the same response as a money page that suddenly points to /.
Metadata and content
Watch titles, H1 headings, meta descriptions and main content where changes matter. Use custom checks for required or forbidden phrases, tracking tags or campaign details.
Structured data
Monitor parsing validity and graph changes on representative templates. Choose fields that matter to the business, such as product identity, price, availability or article details, without assuming that valid markup guarantees a search feature.
Links, hreflang and rendering
Use internal-link, hreflang, raw-versus-rendered and mobile checks where the template warrants them. Not every page needs every expensive rendering check.
Availability and resources
HTTP errors, redirects, soft 404s, robots.txt, XML sitemaps, TLS and DNS may need different owners and schedules from page-content changes.
TechDash lists its current coverage on the features page, including 78 shipped checks plus custom checks. Check the relevant support page before assuming that a check behaves in a particular way.
4. Record a trustworthy baseline
A baseline should represent the intended live state. Do not establish it while a release is incomplete, a staging banner is visible or the site is returning intermittent errors.
Review the first successful result before relying on later comparisons:
- Is the page the expected final URL?
- Is its indexability intentional?
- Is the canonical correct?
- Is rendered content complete?
- Is the structured data the intended version?
- Are known exceptions documented?
The first crawl may establish state rather than open an incident. This is useful because the system needs a comparison point. It also means that adding a broken page does not automatically prove when it broke.
5. Set frequency according to response time
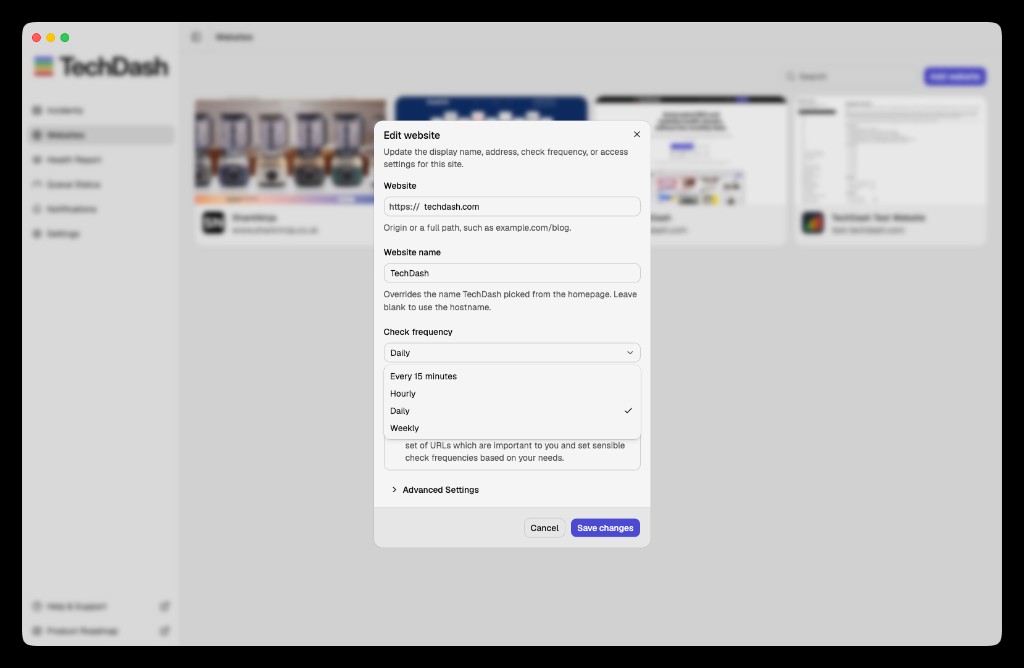
TechDash supports checks every 15 minutes, hourly, daily and weekly. Daily is the default.
Scroll sideways to see every column.
| Risk | Possible cadence | Review expectation |
|---|---|---|
| Active launch, migration or high-risk release | 15 minutes or hourly for a limited window | Named owner available |
| High-value commercial page | Hourly or daily | Same-day review |
| Normal template sample | Daily | Routine queue review |
| Stable low-risk page | Weekly | Weekly review |
Do not set a 15-minute cadence if nobody can respond for two days. Frequent checks use more local resources and can create more repeated evidence during an unresolved incident.
Because TechDash runs on the user's computer, the machine must remain awake and connected. Monitoring can continue after the main window is closed if the application remains in the system tray. Choosing Quit stops monitoring.
6. Assign severity and notification routes
Severity should represent impact and urgency, not how technically interesting a change appears.
Critical
Use for conditions that may justify prompt interruption, such as widespread indexability loss, an important robots block or failure on a revenue-critical page.
Warning
Use for material changes that require review but may not justify paging someone, such as an unexpected canonical or structured-data regression on a template sample.
Advisory
Use for lower-risk observations, trend review or changes likely to be intentional, such as a metadata edit that needs confirmation.
TechDash incidents can use Advisory, Warning and Critical levels. Notifications can go to the desktop, Slack, Microsoft Teams or Discord. Route Critical incidents to the release or operational channel only if that channel has a documented owner.
Custom checks can also be assigned severity and notification behaviour. This allows a forbidden staging phrase to be Critical while an optional phrase remains Advisory.
7. Investigate the evidence
When an incident appears:
- Confirm the affected URL and check.
- Compare the previous and current values.
- Check whether the change was planned.
- Identify whether the source is content, template, header, CDN, CMS or infrastructure.
- Estimate the affected scope.
- Use a full crawl or logs if the selected-page evidence is not enough.
- Fix the source rather than editing one example page when a template is responsible.
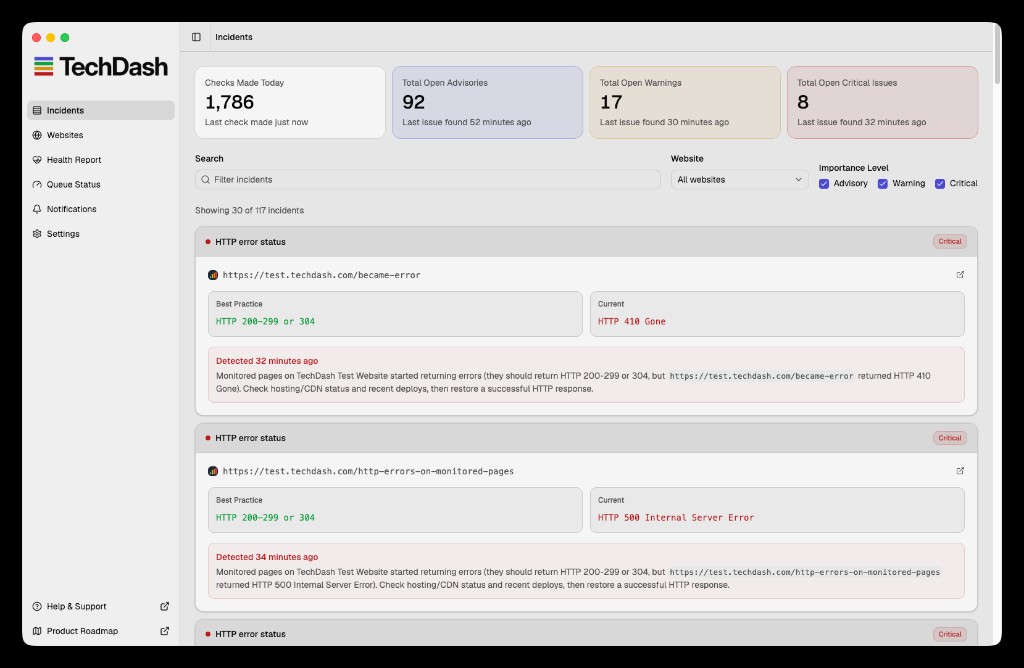
TechDash incident evidence is intended to show the affected URL, severity and supporting details. Multi-URL incidents can help when the same condition appears across monitored pages.
8. Verify the live fix
Do not close the incident because a pull request was merged or a CMS field was edited. Caches, deployment failures, header rules and rendering can leave the live output unchanged.
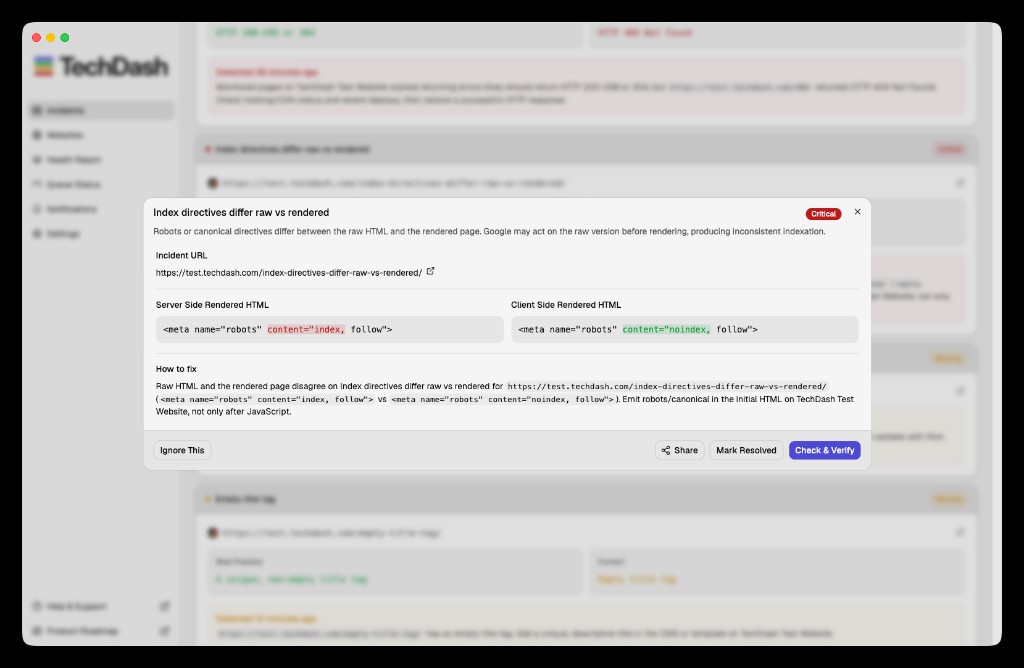
Use Check & Verify after the fix. If the check still fails, return to the source and investigate. If it passes, record the resolution and any preventive action.
Optional recovery notifications can tell the wider team when a previously failing condition passes. Use them where the recovery message helps, not for every low-priority Advisory.
9. Maintain the monitoring set each week
A short weekly review prevents the setup from decaying.
- Resolve or assign open Critical and Warning incidents.
- Review Advisories for patterns.
- Remove retired URLs or update their intended redirect state.
- Add new templates and high-value pages.
- Check for pages that fail repeatedly because of bot challenges or authentication.
- Review the queue and local computer load.
- Reduce frequency where it exceeds the response need.
- Check that Slack, Teams or Discord test messages still arrive.
- Review ignored checks and confirm the reason still applies.
Agencies can use the Health Report to identify which sites need attention. It weights open issues by severity, but a score should start an investigation rather than replace one.
Handling staging and release windows
TechDash supports HTTP Basic Authentication for relevant staging and development sites. The user can choose a Chrome, TechDash or custom user agent in that workflow.
A release process can use both staging and production:
- Establish the intended staging state.
- Check representative templates before cutover.
- Monitor production at a temporarily higher frequency.
- Compare any incident with the release record.
- Verify the live fix.
- Return normal pages to daily or weekly checks after the risk window.
Monitoring does not replace CI. Unit, integration and preview tests should continue to prevent known failures before release. Monitoring covers live conditions, including CMS, header, CDN and configuration changes that may sit outside the main repository.
What this process will not catch
- URLs that were never selected or discovered
- Conditions for which no check exists or was enabled
- Short-lived changes between scheduled runs
- Search-system changes unrelated to the website
- Every cause of traffic or ranking movement
- A local outage while the monitoring computer is asleep or offline
Use scheduled crawling, analytics, rank tracking, logs and Search Console alongside monitoring where those questions matter.
First-week setup checklist
- Name the business risks.
- Choose one URL per important template.
- Add high-value exceptions.
- Add robots.txt and the primary sitemap.
- Select only relevant checks.
- Confirm the first baseline is healthy.
- Set risk-based frequencies.
- Assign severity and owners.
- Test each alert destination.
- Seed one safe test change if possible.
- Verify the fix against the live page.
- Review noise and capacity after seven days.
Frequently asked questions
Should I monitor every page?
Not at first. Start with representative templates and commercially important pages. Use a crawler for wider discovery and expand the monitoring set when a specific risk justifies it.
Is daily monitoring enough?
It can be for routine pages. A launch, migration or revenue-critical template may justify a shorter temporary interval. The right cadence depends on how quickly somebody can respond.
What if a planned content edit opens an incident?
Review and resolve it as expected, or adjust the check if that type of change does not require action. Avoid disabling broad checks merely to hide normal editorial work.
Can TechDash monitor without Search Console?
Yes. Search Console is optional. The core website checks run independently.
Where is monitoring data stored?
TechDash states that the monitored site list, crawl history, HTML and screenshots remain on the user's computer. Optional integrations connect directly to the services they require.
Next step
Choose one important template and build the complete loop: baseline, schedule, severity, owner, notification and verification. If that workflow is useful, expand it using TechDash technical SEO monitoring and the relevant support documentation.
Put this workflow on a desktop watchlist
TechDash runs scheduled SEO and site-health checks on your computer. It does not replace crawling, rank tracking, analytics or Search Console.