Website regression monitoring for developers
A deploy can change a canonical, a robots rule, or a title without failing CI. TechDash is a lightweight watch outside the pipeline: it checks the URLs you care about after the release, shows the before/after, and can ping Slack, Teams or Discord.
The gap CI does not cover
A green pipeline means the tests you wrote passed. It does not mean production still has index,follow, a self-canonical, or an intact JSON-LD block. Those values often come from a CMS, a header include, or a robots file that is not in the same repo as the app.
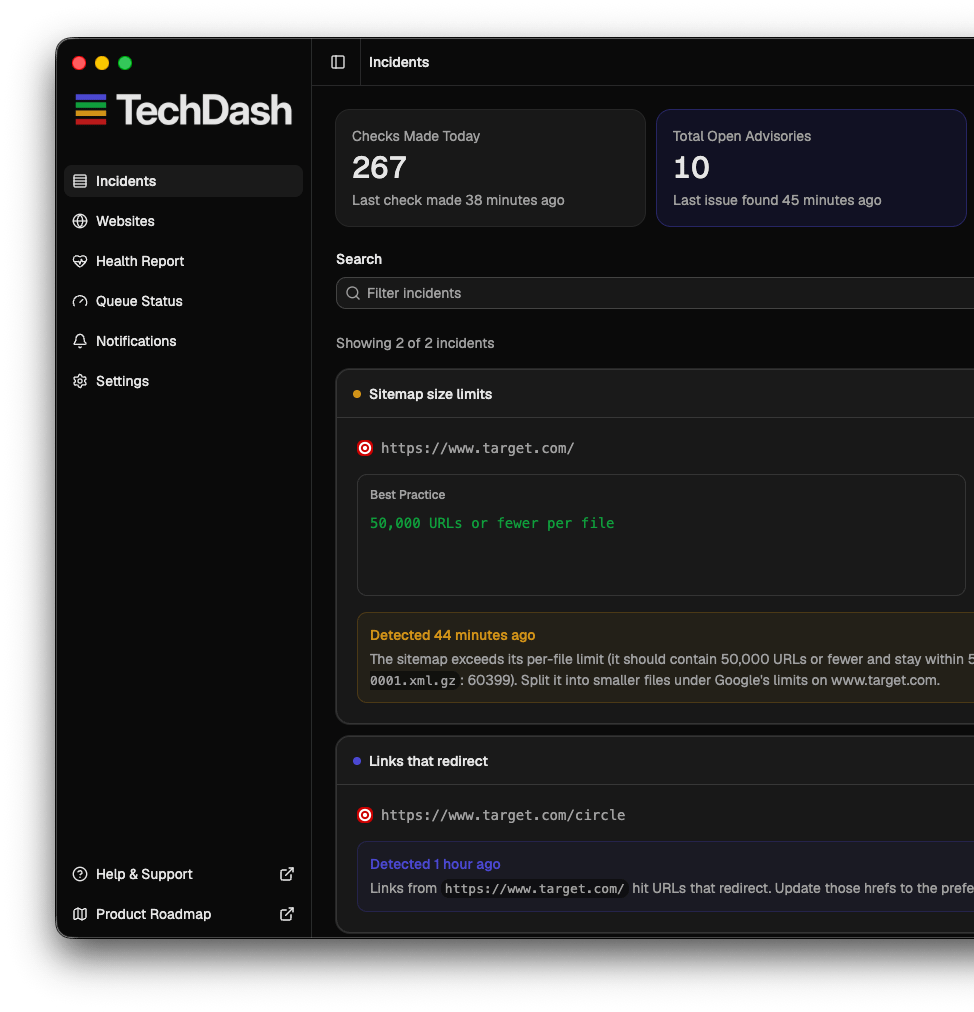
TechDash is a safety net for that gap. It is SEO change monitoring software that runs on your computer and opens an incident when a watched signal changes.
What commonly breaks on deploy
- Robots meta or
X-Robots-Tagcopied from staging - A canonical helper given an empty path, so money URLs point at
/ - A redirect map that swallows a directory
- A component that fails to render, so schema disappears
- A title fallback of “Untitled page” after a merge
The high-intent checks are on noindex, canonical and robots.txt monitoring. The deploy playbook is SEO regression monitoring after deployments.
A workflow that stays out of the way
- Add staging (Basic Auth) and production.
- Monitor one URL per template that can hurt search or revenue.
- Keep daily as the default. Raise frequency during a launch or migration.
- Send Critical incidents to the same Slack or Teams channel as deploy notes.
- Fix the template or config, then Check & Verify. Do not treat “we merged” as proof.
Why desktop, not another cloud runner
You already have a machine. TechDash uses it to fetch pages, render when needed, and store crawl history locally. Licence checks do not send your site list. That is a better fit than standing up another hosted crawler for a job you can run next to the terminal. See desktop SEO software.
Questions
Is this a CI plugin?
No. Unit tests and preview checks still belong in CI. TechDash watches production and staging after the release, including changes that never went through the build: CMS edits, CDN rules, robots.txt, and header config.
Can I monitor staging?
Yes. HTTP Basic Authentication is supported so password-protected staging can be checked before cutover. You can pick a Chrome, TechDash, or custom user agent for those hosts.
What should I put on the watchlist?
One URL per critical template, plus robots.txt and the primary sitemap. Add launch and legal pages during a release window. You do not need every archive URL on day one.
Where do alerts go?
Desktop notifications on the machine running TechDash, plus optional Slack, Microsoft Teams or Discord webhooks. Use Critical for indexability and robots blocks so a title tweak does not page anyone.
Does the laptop have to stay on?
Monitoring pauses if the machine sleeps and resumes when it is back. Park TechDash on a workstation that stays awake if you want coverage overnight.
How is this priced?
A one-off desktop licence on one computer at a time, transferable by you. No per-environment cloud quota. See homepage pricing for current licence pricing.
Buy the desktop licence. Keep the crawl data local.
One-off licence, 78 shipped checks, Slack/Teams/Discord or Daily Digest alerts, and no monthly monitoring subscription. $179 one-off.