SEO regression monitoring after website deployments
By TechDash · Published 1 September 2026 · Updated 2 September 2026
A successful deployment does not prove that production still exposes the intended SEO signals. A CMS setting, CDN rule, response header, rendering failure or environment variable can change the live page without failing the tests in the main codebase.
SEO regression monitoring sits beside CI. Test known conditions before release, then check representative staging and production URLs after deployment. If an incident appears, inspect the live evidence, fix the source and rerun the check.
Monitoring does not replace CI
CI should test code and configuration before release. Production monitoring checks the result that users and crawlers can reach afterwards.
Scroll sideways to see every column.
| Layer | Best at | Example gap |
|---|---|---|
| Unit and integration tests | Known code behaviour | CMS content outside the repository |
| Preview or staging tests | Pre-release rendering | Production-only CDN or header rules |
| Deployment health checks | Availability and core transactions | A page that returns 200 with noindex |
| SEO regression monitoring | Repeated checks on live SEO conditions | An unmonitored template or URL |
| Full-site crawl | Broad discovery and diagnosis | A short-lived change between crawls |
Use more than one layer where the risk warrants it.
What commonly changes after a deployment
Indexability directives
A staging robots meta value or X-Robots-Tag header can reach production. Monitor representative URLs for their intended indexability and record deliberate exceptions.
Canonical generation
An empty path, hostname or locale value can make canonicals point to /, a staging domain or the wrong language. Check both the emitted URL and the health of the target.
Robots.txt
A deployment or infrastructure change can alter robots.txt. A copied Disallow rule may affect an entire directory. Monitor availability, content changes and production-specific rules that must not appear.
Redirects and response codes
Routing changes can introduce loops, chains, temporary redirects or errors. A page may also return 200 with content that resembles an error, creating a soft 404 condition.
Structured data
A component can fail to render JSON-LD, produce invalid syntax or omit important fields. Valid markup still needs to reflect the visible page and the intended entity.
Titles, headings and content
Fallback values can produce “Untitled page”, duplicate headings or missing main content. Monitor stable representative pages rather than every editorial change.
Raw and rendered output
JavaScript failures can leave raw HTML and rendered content in different states. Use rendering checks on templates that depend on client-side code. Do not spend that resource on pages where a simple fetch answers the question.
Build the deployment watchlist
Choose one URL per template that the release can affect:
- Homepage
- Category or listing template
- Product or service detail
- Editorial article
- Location or language variant
- Conversion page
- Pagination or facet example
- robots.txt and primary sitemap
Add specific high-value URLs and the paths named in the release. A small release that changes one component does not always need the same watchlist as a platform upgrade.
TechDash for developers recommends one URL per critical template, plus robots.txt and the primary sitemap. This is a representative watch, not complete crawl coverage.
Use staging where it represents production
TechDash supports HTTP Basic Authentication for relevant staging and development sites. The user can choose a Chrome, TechDash or custom user agent in that workflow.
Before relying on staging evidence, document important differences from production:
- Hostname and canonical rules
- Intentional
noindex - robots.txt policy
- CDN and cache behaviour
- Environment-specific analytics
- Authentication
- Data and third-party integrations
A staging page may be intentionally non-indexable. The useful test is not whether staging matches production in every field, but whether each environment matches its own expected state.
Set a release-window cadence
TechDash supports 15-minute, hourly, daily and weekly schedules. Daily is the default.
For a high-risk release, a team might temporarily set representative pages to every 15 minutes or hourly, provided somebody can respond. Return them to the normal daily or weekly cadence after the risk window.
The application runs on the user's computer. Monitoring pauses if the machine sleeps or loses internet access. Use a workstation that remains available if overnight release coverage is required.
Route alerts with release context
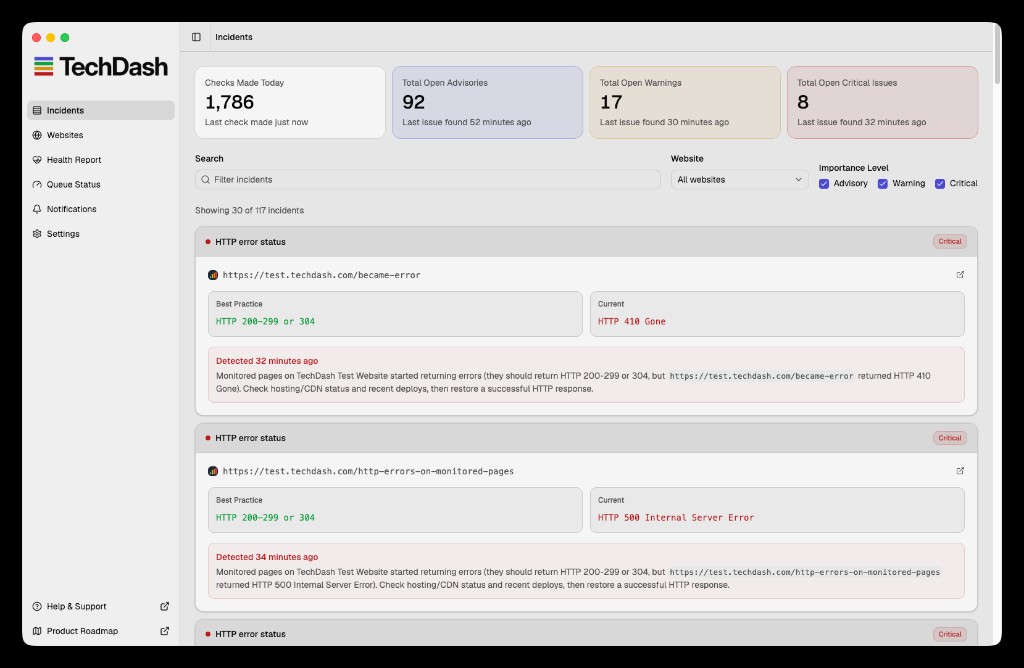
Send Critical incidents to the same Slack, Microsoft Teams or Discord channel that carries deployment notes only if the channel has an owner. Include:
- Release identifier
- Deployment time
- Affected URL and template
- Condition before and after
- Whether rollback is available
- Investigator
- Live verification result
Keep lower-priority metadata changes out of the paging route unless the release makes them important.
Write a monitoring policy for each release class
Not every deployment needs the same controls. A small copy change and a routing-system release should not create identical operational work.
Scroll sideways to see every column.
| Release class | Suggested coverage | Temporary cadence | Possible stop condition |
|---|---|---|---|
| Content-only change | Edited pages and one template sample | Daily unless business risk is higher | Live content and metadata verified |
| Component release | One URL per affected template | Hourly during the release window | Representative pages pass after cache expiry |
| Routing or canonical change | Priority URLs, path variants and resources | 15 minutes or hourly with an available owner | Redirects, canonicals and indexability pass |
| Rendering change | Raw and rendered samples across affected templates | Hourly or daily according to risk | Rendered content and markup remain stable |
| Platform or CMS release | Broad representative set plus a full crawl | Shorter cadence during cutover | Critical checks pass and wider crawl is reviewed |
Document the chosen coverage in the release ticket. This makes later gaps visible. If an unmonitored template fails, the team can improve the policy rather than claiming the monitor should have known about it.
Fix forward or roll back
Monitoring evidence can inform the decision, but the tool should not make it automatically.
Rollback may be appropriate when a high-impact regression is widespread, the previous release is safe and recovery is faster than diagnosis. Fixing forward may be more appropriate when rollback would remove other important work, the change is isolated or the cause is understood.
Whichever route is chosen, verify the production result. If a template caused the incident, test more than the original sample. Record the release, decision, owner and final check so the same failure can become a pre-release test.
Investigation sequence
- Confirm that the incident began after the deployment.
- Review the previous and current values.
- Test more URLs from the same template.
- Compare staging and production where appropriate.
- Inspect the component, CMS, response headers, CDN and environment configuration.
- Run a wider crawl if the scope is uncertain.
- Decide whether to fix forward or roll back.
- Rerun the live check.
- Record the cause and add a preventive test where possible.
Do not assume timing proves causation. A content edit or infrastructure change may have occurred near the deployment.
Verify production, not only the code change
A merged fix can fail to deploy, remain behind a cache or affect only part of the site. Use Check & Verify against the live page.
If the condition passes, check a second representative page when the cause was template-wide. Optional recovery notifications can update the wider team, but they should not replace the release record.
Post-deployment checklist
Before release
- Define affected templates and URLs.
- Confirm intended indexability and canonicals.
- Check staging output.
- Add temporary custom assertions if needed.
- Confirm alert owners and rollback route.
- Check that the monitoring computer will remain available.
Immediately after release
- Confirm response codes and redirect behaviour.
- Check robots meta and
X-Robots-Tag. - Check canonical targets.
- Fetch robots.txt and the primary sitemap.
- Check titles, H1s and main content.
- Validate structured data on representative templates.
- Compare raw and rendered output where relevant.
- Confirm analytics or tag presence if included in the release.
After an incident
- Review before-and-after evidence.
- Establish scope.
- Fix the source or roll back.
- Check and verify the live page.
- Add a CI or preview test where feasible.
- Return temporary schedules to normal.
Limitations
Selected-page monitoring cannot discover every new or broken URL. A release can affect an unmonitored template, and a temporary regression can occur between checks. Keep full crawls, log review, CI, analytics and Search Console in the release process where appropriate.
TechDash is not a CI plugin or a hosted runner. Its local computer and internet connection must remain available. Its benefit is observing live pages and site resources outside the pipeline, not guaranteeing complete release safety.
Frequently asked questions
Should we monitor staging and production?
Use both when staging is representative enough to catch useful problems. Record intentional differences, especially indexability and canonical rules.
How many pages should a deployment watch include?
Start with one stable URL per affected template and add high-value exceptions. Use a full crawl when the release has broad or uncertain scope.
Should every incident block a release?
No. Blocking policy should follow severity, scope and business risk. An unexpected noindex can deserve a different response from an intended title edit.
Does a passing monitor prove the deployment is safe?
No. It proves only that the selected checks passed on the selected URLs at that time.
Next step
Add a monitoring section to the release template: URLs, expected conditions, temporary cadence, alert owner and live verification. Review TechDash's developer workflow and crawl access and rendering checks for the relevant setup details.
Put this workflow on a desktop watchlist
TechDash runs scheduled SEO and site-health checks on your computer. It does not replace crawling, rank tracking, analytics or Search Console.